RCS, as measurable as your website.
Track delivery, reads, taps, conversions, and cost in one dashboard, broken down by sender, protocol, bot, and campaign. It’s UTM-style tracking for the messaging inbox: see exactly what customers did, and prove the lift over SMS with real numbers.
- Delivery, reads, and taps
- Conversion tracking
- RCS vs SMS proof
- CSV and warehouse exports
Billing-linked messaging usage
- SMS outbound128,400 units$963.0075.0%
- SMS inbound18,600 units$139.5010.9%
- MMS outbound4,120 units$82.406.4%
- RCS outbound38,900 units$58.354.5%
- RCS inbound9,240 units$41.153.2%
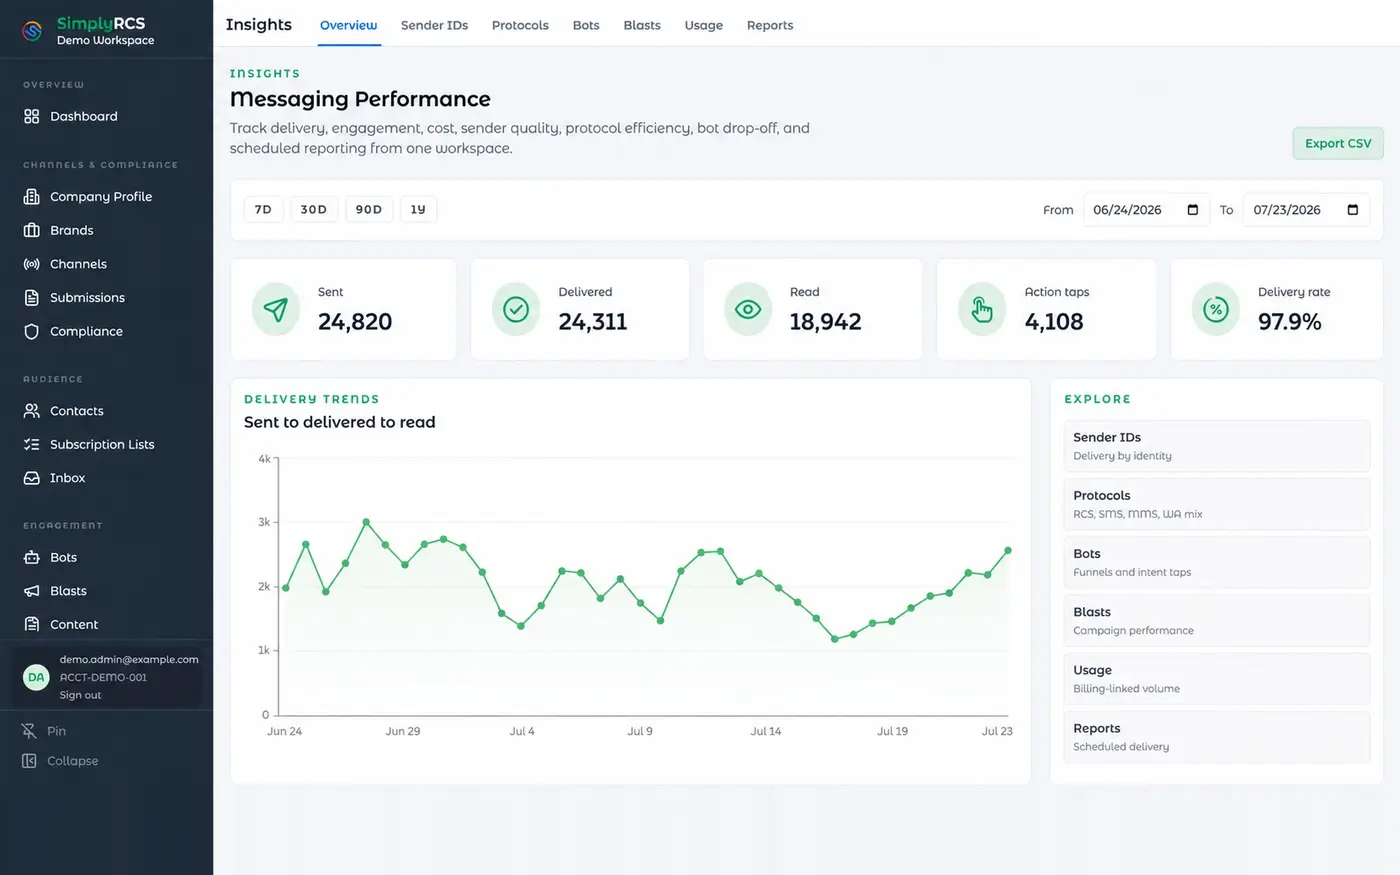
SMS gives you “sent.” That’s not a metric.
For decades, business texting analytics meant one number: sent. Maybe, on a good day, delivered. You never knew if anyone read it, what they tapped, or whether it drove a single sale, so messaging stayed a black box you couldn’t optimize and couldn’t defend in a budget meeting.
RCS changes the math. Every message reports back: delivered, read, tapped, converted. SimplyRCS puts it all in one dashboard with per-channel breakdowns, so you can finally treat messaging like the measurable, optimizable channel it should have been all along.
Every message, measured end to end.
From the moment a message sends to the tap that converts, here’s what the dashboard tracks.
Delivery
Sent, delivered, and delivery rate by sender, channel, and campaign: see exactly what reached the network and what landed.
Reads
Per-message read receipts and read rate: know not just that a message was delivered, but that it was actually seen.
Taps & engagement
Tap-level tracking on every button, card, and carousel: see precisely which actions customers took inside the message.
Conversions
Tie taps to outcomes (checkouts, bookings, redemptions) and measure what each campaign actually earned.
Cost
Spend by channel and campaign, with carrier and registry fees itemized at cost, so cost-per-result is always clear.
Channel mix
RCS vs MMS vs SMS volume and performance side by side: see how each channel pulls its weight.
See every tap, like you see every click on your site.
On your website, you track every click: which link, which button, which path to purchase. RCS finally brings that to messaging. SimplyRCS records tap-level engagement on every suggested reply, button, and carousel card, so you can see the exact path a customer took inside the conversation and attribute the conversion to the message that drove it.
- Button and chip taps: which suggested actions customers pressed
- Carousel engagement: which cards they swiped to and tapped
- Path tracking: the sequence of taps through a flow or bot
- Attribution: connect the tap to the conversion it produced
Settle the RCS-vs-SMS question with your own data.
Because RCS campaigns fall back to SMS on non-RCS devices, every blast is effectively a built-in experiment: the same message, delivered both ways. SimplyRCS breaks down performance by the channel each recipient actually received, so you can show, in your own numbers, how RCS read and tap rates compare to the SMS fallback in the very same campaign. No vendor claims required, just your dashboard.
- Same-campaign comparison: RCS vs SMS-fallback performance, side by side
- By actual delivered channel: measured on what each recipient really received
- Read and tap deltas: quantify the engagement lift in your own data
- Budget-ready: export the proof for the next planning meeting
Illustrative figures. For attributed, dated engagement statistics see The State of RCS 2026.
From org-wide overview to a single delivery receipt.
Start at the org level (total volume, top bots, highest-reach campaigns) then drill into any dimension. Filter by date, sender, protocol, bot, or campaign. Open the raw delivery and inbound data when you need receipt-level detail.
Export anywhere. Report on a schedule.
Your data isn’t trapped. Export any view to CSV, pull the raw MO and MDR downloads, schedule recurring reports, or pipe results into your data warehouse or BI tool. Whatever lives downstream (Looker, Power BI, a spreadsheet) gets fed.
- CSV export: any view, any time
- Scheduled reports: recurring summaries delivered automatically
- MO & MDR downloads: receipt-level inbound and delivery data
- Warehouse-ready: feed your BI stack
A weekly CSV export is delivered to your inbox, automatically.
Blasts, bots, and conversations, all in one report.
Because building, sending, and conversing all happen on one platform, the analytics see everything. Your blast reach, your bot’s deflection rate, your inbox response times, and your conversion data live in the same dashboard, no stitching together exports from three tools to answer one question.
All three surfaces in one dashboard, no stitching exports together.
RCS analytics questions.
Can you track RCS messages?
Yes. RCS supports delivery and read receipts plus tap-level engagement, so you can track whether a message was delivered, read, and which buttons or cards the customer tapped. SimplyRCS surfaces all of this in one dashboard, broken down by sender, channel, bot, and campaign, with CSV and warehouse exports.
How do you measure RCS performance?
Measure RCS across the full funnel: delivery rate, read rate, tap-level engagement, conversions, and cost per result. SimplyRCS also breaks performance down by the channel each recipient actually received, so you can compare RCS against its SMS fallback in the same campaign.
Does RCS support read receipts and delivery status?
Yes. RCS provides per-message delivered and read receipts, plus typing indicators, giving real-time visibility into whether a message was delivered and opened, far more than SMS, which at best confirms delivery. SimplyRCS reports these for every message.
Can I track conversions from RCS campaigns?
Yes. SimplyRCS tracks tap-level engagement on buttons, chips, and carousel cards and ties those taps to outcomes like checkouts, bookings, and redemptions, so you can measure what each campaign actually earned, similar to UTM tracking on a website.
How can I prove RCS works better than SMS?
Because RCS campaigns fall back to SMS on non-RCS devices, each campaign effectively compares both channels. SimplyRCS reports performance by the channel each recipient actually received, letting you show RCS’s read and tap lift over the SMS fallback using your own data, which you can export for reporting.
Can I export my RCS analytics?
Yes. Export any view to CSV, download raw MO (inbound message) and MDR (delivery receipt) data, schedule recurring reports, or feed results into your data warehouse or BI tool.
What can I break my RCS data down by?
You can filter and drill down by date, sender ID, protocol (RCS/MMS/SMS), bot, and campaign, and open receipt-level detail including actual channel, fallback outcome, carrier, brand, program, status, and contact.
Is the analytics included or an add-on?
Included. Real-time analytics, tap tracking, and exports come standard with the free SimplyRCS software, so there is no separate analytics tier or add-on fee.
Stop guessing. Start measuring.
Book a demo and we’ll walk the analytics dashboard live: delivery, reads, taps, and the RCS-vs-SMS lift, on real data. Or start free with a sender ID test and watch your own numbers populate.